Description: PNG image
|
| From: | Nenad Pekez |
| Subject: | Re: [lwip-users] lwIP RAW - Low throughput during first few seconds |
| Date: | Wed, 27 Jun 2018 14:02:03 +0200 |
| User-agent: | Mozilla/5.0 (Windows NT 6.1; WOW64; rv:52.0) Gecko/20100101 Thunderbird/52.8.0 |
|
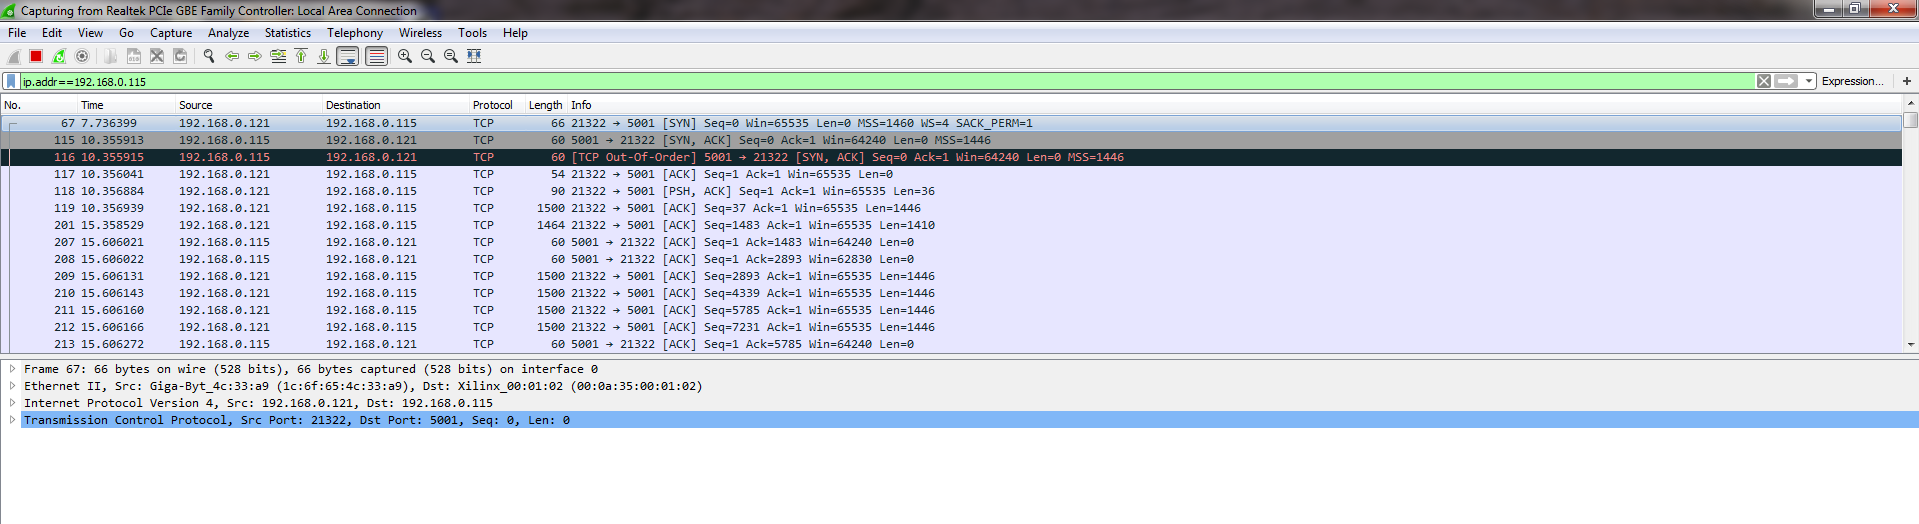
Hi Simon,
these are steps I have taken in order to investigate this problem:
What these outputs mean, can someone explain me? Since
tcp_slowtmr should be called every 500ms, there is at least 3
seconds of pause there. I have also turned lwip netif debug, but no errors are
reported. I am using Xilinx drivers, so I am still trying to
figure out is there a way to print some debug options from that
layer. Oh, I forgot to say that we are using lwip 1.4.1. Also, I
didn't notice this problem when we test throughput in opposite
direction, sending data from Zynq to PC (if that means
anything). Best regards, P.S. I can send entire Wireshark capture, but it is quite
large, maybe there is some practical way to upload entire
capture?
|
![]() ws_cap0.png
ws_cap0.png
Description: PNG image
![]() lwip_ip_stats.log
lwip_ip_stats.log
Description: Text document
![]() lwip_link_stats.log
lwip_link_stats.log
Description: Text document
![]() lwip_tcp_mem_stats.log
lwip_tcp_mem_stats.log
Description: Text document
![]() lwip_tcp_dbg.log
lwip_tcp_dbg.log
Description: Binary data
| [Prev in Thread] | Current Thread | [Next in Thread] |