|
| From: | Jim Busser |
| Subject: | [Gnumed-devel] Report generator Visualize button tooltip |
| Date: | Mon, 08 Aug 2011 10:32:44 -0700 |
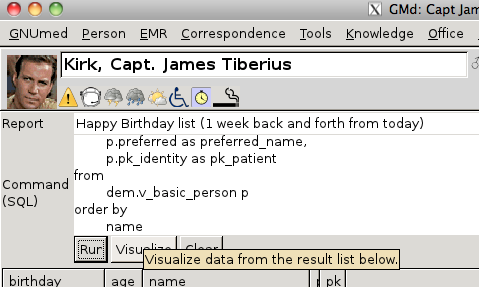
Can the tooltip make clearer that GNUplot will handle only numeric data
(assuming that is true)

        Visualize results from two columns below (must be numeric data).

The logic could be expanded to allow a one-column selection which would make it
a scatter plot.

Shame gnuplot cannot (?) support numeric plus categorical data≥ maybe it can if
it would later be of interest to someone to investigate.

-- Jim
| [Prev in Thread] | Current Thread | [Next in Thread] |