I think the amplitude spectrum is the DFT:
So, it has sign. The power spectrum is the absolute value so it has no sign.
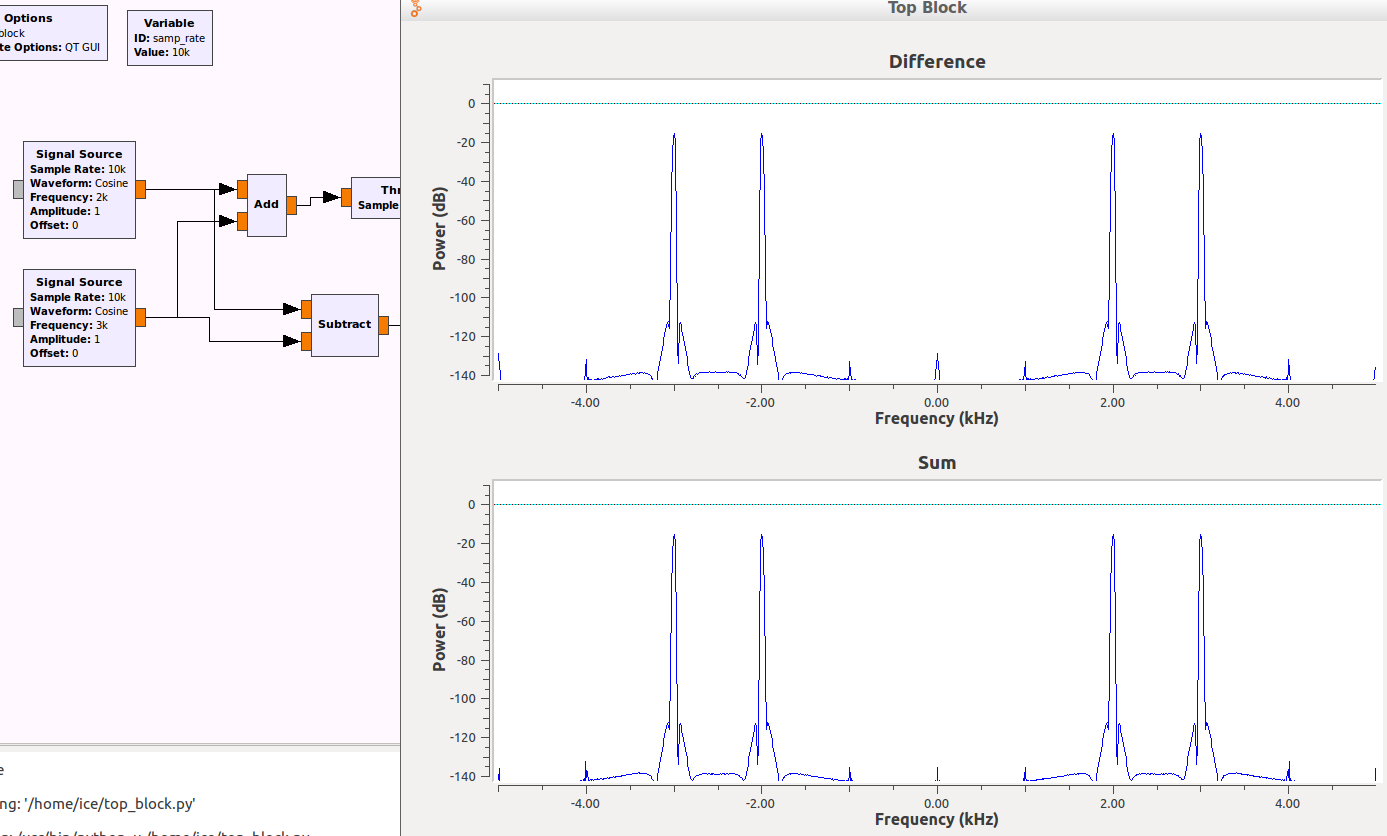
I wish to be able to see the difference in the spectrum between this two signals below. If the signal generators are A and B, A+B and A-B are different signals, but in the power spectrum we see them as the same signal, so I woul like to be able to difference one from the other from their spectrum.
regards
El 26/04/17 a las 09:52, Marcus Müller escribió:
Hey Fernando,
not quite sure I get what you need; I'd say the Amplitude Spectrum you'd be looking for is
or, rather, the decibel representation of that. There's no way to get a negative number out of the absolute of something – it's by definition a positive real number.
Now, we could also use our freedoms to define our amplitude spectrum to take the shape
But: that's really only useful if you have phase-coherent reception – as an analytic tool for an unsynchronized observation of the spectrum, it doesn't help you much, since you have a random
due to having random relative phase.
So, maybe it'd be a good idea to formulate what purpose you're doing this for :) You can, indeed, tell 180° out-of-phase signals apart by this, but I'd argue that being 180° out-of-phase, for the most things I can think of, is only meaningful on one and the same frequency – and hence, I'm not quite sure this is what you're looking for!
Best regards,
Marcus
On 25.04.2017 12:01, Fernando wrote:
Hello.
Yes, with Time sink I can see the difference, but if the signal is compound of some other signals (for instance signal=1K/amplitude +1 +2K/amplitude -1 +3K/qamplitude +1 +4K/amplitude +1 ) i would like to see the 2k signal as -1 amplitude, but in the power spectrum it will appear as possitive and in the QT time sink it is very difficult to see the signal as it is a complex one.
regards
El 25/04/17 a las 10:57, Jinyang Lee escribió:
Hello Fernando,
I think the QT GUI time sink displays the relationship between time and amplitude. You can see the signal through it. But when I use the channel model block,the QT2 can see the signal which is zero.Enclose is running result with channel model and with channel model.
Regards,Lee
2017-04-25 15:45 GMT+08:00 Fernando <address@hidden>:
Hi.
Is there a way of visualizing ampitude spectrum (with + and - signals)
instead of power spectrum?
regards
_______________________________________________
Discuss-gnuradio mailing list
address@hidden
https://lists.gnu.org/mailman/listinfo/discuss-gnuradio
_______________________________________________
Discuss-gnuradio mailing list
address@hidden
https://lists.gnu.org/mailman/listinfo/discuss-gnuradio
_______________________________________________ Discuss-gnuradio mailing list address@hidden https://lists.gnu.org/mailman/listinfo/discuss-gnuradio
![$$A_{|\cdot|}[f]=|X[f]| = \left\lvert\sum_{n=0}^{N-1}
x[n]\cdot e^{j2\pi \frac {nf}N}\right\rvert $$](pngs8OgwRdyed.png)
![$$A_\text{signed} = s(X[f]) |X[f]|\text{ with }
s(X[f])=\begin{cases}1&\text{for } -\pi \le \angle X[f]
< \pi \\ 0 &\text{else.} \end{cases}$$](pngwqYRx8DEP8.png)