Hi Marcus
of course in gnu, I used a band pass filter. But I have spikes in the center frequency of the signal.
That's what I don't understand – how did you put them together?
I saved the received signal in a file, then I did further steps in matlab (FFT, gathering ...).
Best regardsof course in gnu, I used a band pass filter. But I have spikes in the center frequency of the signal.
That's what I don't understand – how did you put them together?
I saved the received signal in a file, then I did further steps in matlab (FFT, gathering ...).
On Tue, Oct 27, 2015 at 10:50 AM, Marcus Müller <address@hidden> wrote:
Hi Maksim,
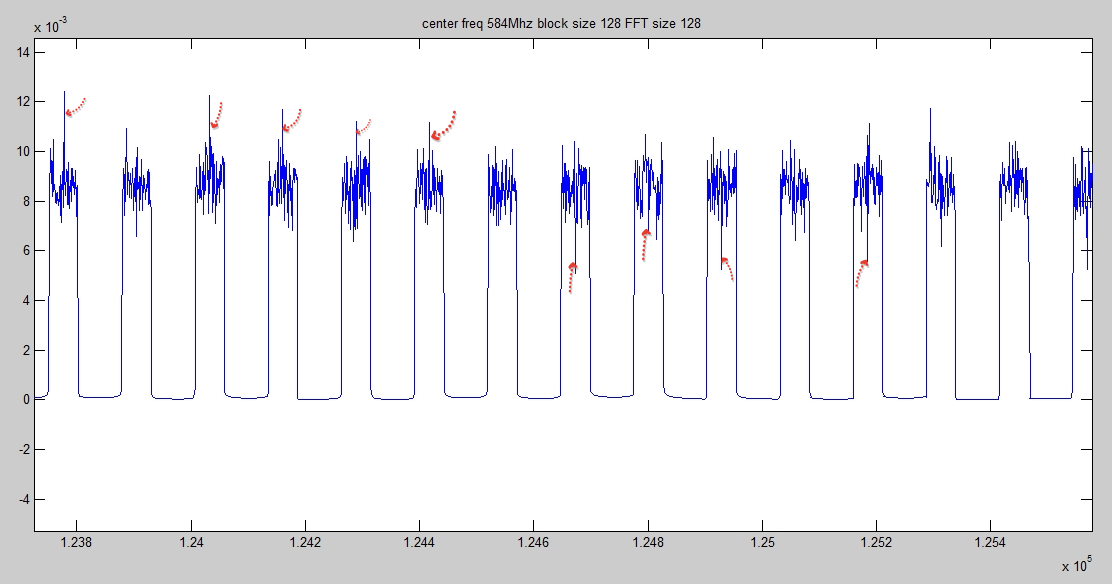
In the receiver I made FFT and plot the correspond figure.So, that's pretty clearly frequency domain of the receive signal, right?
So that might answer your question regarding DC offset: If there is DC offset, you'd see a constant spike at the center frequency. That's not really the case here, if I understand correctly.
The last figure which I sent it is the signal in the frequency domain which are repeated with each transmission "I put them all together to compare them."That's what I don't understand – how did you put them together?
Best regards,
Marcus
On 10/27/2015 10:44 AM, scott tiger wrote:
MaksimThank you for your replyI attached the same figure with more explanation "each black block is the signal in the frequency domain", but block 1 .....n is the same signal transmitted in different times.Hi Marcus,I generate ZC sequence "its amplitude equals to 1 in frequency domain" then I made IFFT and transmit the signal using USRP. The environment is a cable. I received the signal from another antenna of the same USRP. In the receiver I made FFT and plot the correspond figure. Since, I am the source file in the transmitter transmit the signal many times"repeat activated". The last figure which I sent it is the signal in the frequency domain which are repeated with each transmission "I put them all together to compare them."
Y-Axis is the amplitude "abs(of the complex signal)".
X-Axis is not pure frequency domain or time domain, because the figure is drown from follow:
Best regards
On Mon, Oct 26, 2015 at 4:47 PM, Marcus Müller <address@hidden> wrote:
Hi Maksim,
Could you keep this on the mailing list?
I don't fully understand:
> In fact, the figure shows repeated OFDM signal, each of it in frequency domain.
So you take the OFDM signal, and shift it in frequency domain, and then have N identical OFDM signals transmitted at the same time?
Can you clearly state what your X-Axis and what you Y-Axis are?
For example, I transmitted a zadoff-chu sequence which has a flat characteristic in frequency domain. The environment was a short cable with attenuation. The received signal also showed in frequency domain.
I attached it also "the figure shows the repeated sequences 2Mhz bandwidth in frequency domain". What I am curious about are spikes which appear usually in the center frequency? I thought may it is related some how with dc offset in USRP.
I don't understand this graph:
What is the X-Axis, what is the Y-Axis?
Maybe you meant that you take values from a Zadoff-Chu sequence, IFFT them, thus generating an OFDM signal (which, by the way, is also a ZC sequence), add guard intervals and transmit them?
I'm really getting intrigued by what you observe :) but we'll really have to understand the graphs, which at this point, I'm afraid, I don't.I attached it also "the figure shows the repeated sequences 2Mhz bandwidth in frequency domain". What I am curious about are spikes which appear usually in the center frequency? I thought may it is related some how with dc offset in USRP.
Best regards,
Marcus