Description: PNG image
|
| From: | Fabian Schwartau |
| Subject: | Re: spectrum analyzer problem |
| Date: | Wed, 30 Jun 2021 11:57:05 +0200 |
| User-agent: | Mozilla/5.0 (X11; Linux x86_64; rv:78.0) Gecko/20100101 Thunderbird/78.11.0 |
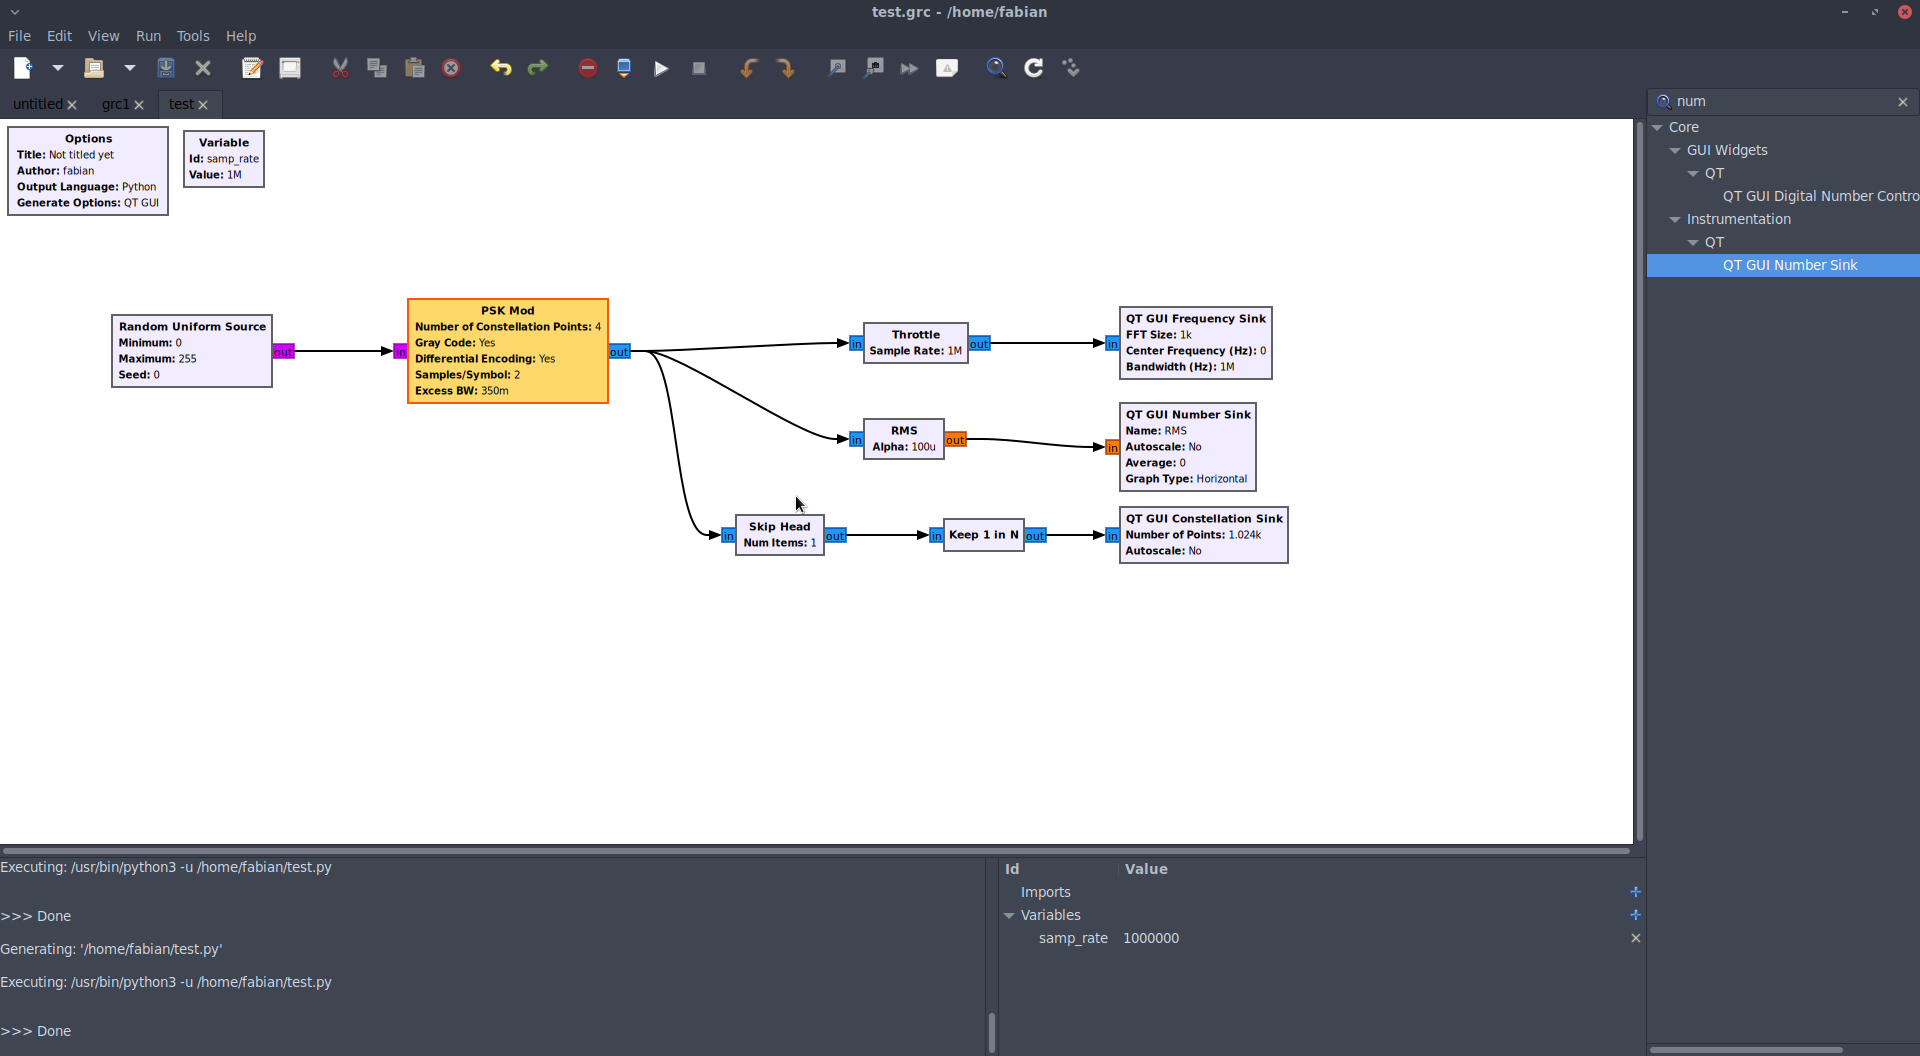
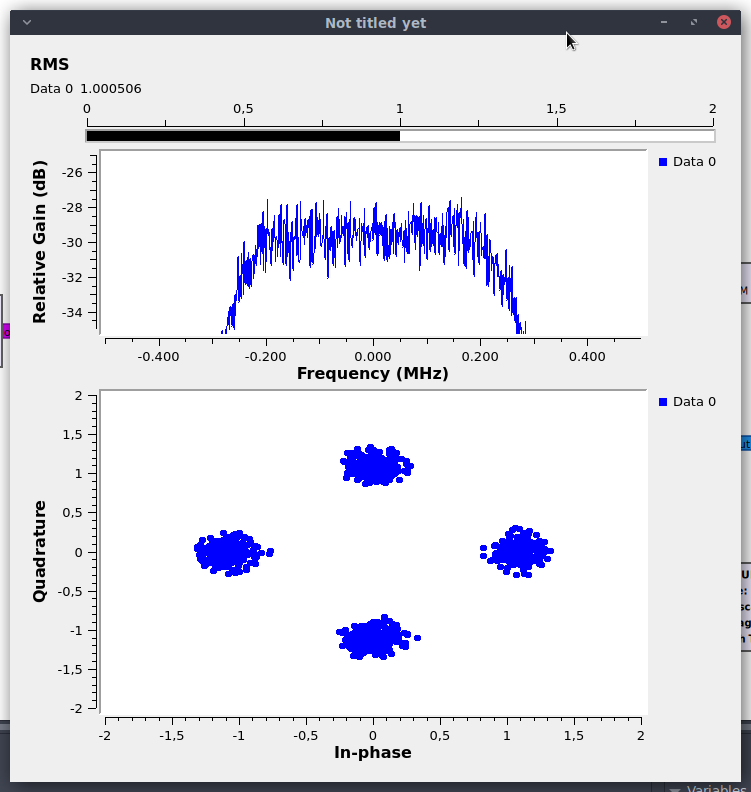
Hi Ali,
you should provide an example flow graph.
And I think I heard several times on this list, that you should not use
version 3.7 any more, as it is fairly old and not maintained any more.
Nevertheless, I hacked together a small flowgraph, where I cannot
reproduce your problem. I generate a QPSK constellation, the output RMS
value is 1 (which makes the peak values slightly larger than 1!) and the
1000 point FFT with a rectangular window shows -30 dB. When you generate
a constellation with 2 samples per symbol and make the symbol values to
have a value of 1, you will probably get 3 dB less than expected, as the
intermediate samples have less power than 1.
Attached is the flowgraph and the results.

Best regards,
Fabian

Am 30.06.21 um 11:19 schrieb Ali G. Dezfuli:
> Hi all,
>
> I wonder if this is a bug or what:
> I just make a QPSK constellation on the unit circle with quite random
> data and
> look at the spectrum by "QT GUI Frequency Sink" block in GRC.
> With these parameters:
>     FFT size = 1000
>     Window type = None OR Rectangular
> I should see a flat line as the spectrum with -30 dB (= -30 dBW) but
> surprisingly it
> shows -33 dB !!!
> I use GNU Radio Companion 3.7.13.4 and ubuntu 16.04.
> Would be grateful if you could help me in this matter.
>
> regards,
> Ali
![]() flowgraph.png
flowgraph.png
Description: PNG image
![]() result.png
result.png
Description: PNG image
![]() test.grc
test.grc
Description: application/gnuradio-grc
| [Prev in Thread] | Current Thread | [Next in Thread] |