help-octave
[Top][All Lists]
Advanced

[Date Prev][Date Next][Thread Prev][Thread Next][Date Index][Thread Index]

Re: 2d histrogram function and example


From: Mono Brezel
Subject: Re: 2d histrogram function and example
Date: Mon, 4 Nov 2019 03:13:30 +0800

Hello Doug,

thanks for the fast response.

After installing the statistics package , I was able to run the hist3 example.
On the other hand, I am not able to find the hist2d function. Do I need to install any additional package?

Refer to  generated plots using python matplotlib:

Thanks Again for your help.

Regards,
C


Am Fr., 1. Nov. 2019 um 00:01 Uhr schrieb Doug Stewart <address@hidden>:


On Thu, Oct 31, 2019 at 11:23 AM Mono Brezel <address@hidden> wrote:
Hello all,

I am a new user of Octave and I am not familiar with the syntax yet, therefore my basic question. Is there any function similar to this one


I was not able to find examples in the documentation .

Thanks for your support.

Regards,
C

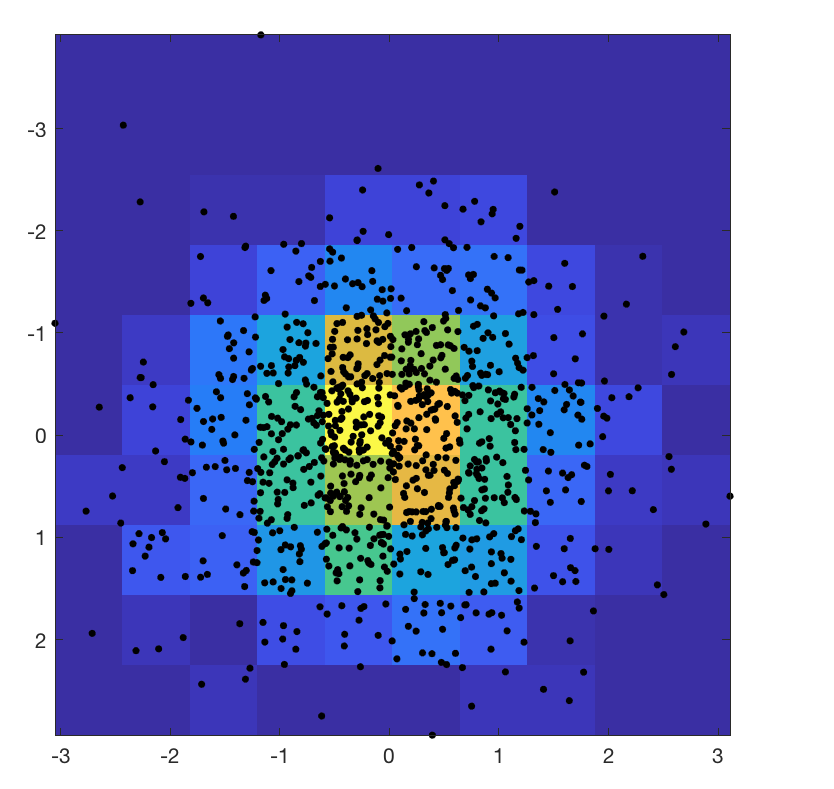
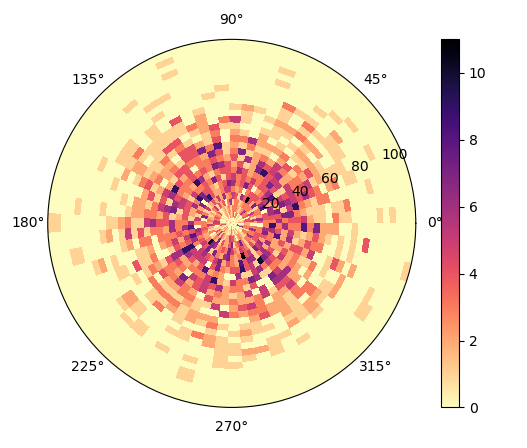
there is a hist3 in the statistics package
and there is a hist2d


--
DASCertificate for 206392

Attachment: 2d_Histogram.png
Description: PNG image

Attachment: 2d_polarhistogram.png
Description: PNG image


reply via email to

[Prev in Thread] Current Thread [Next in Thread]