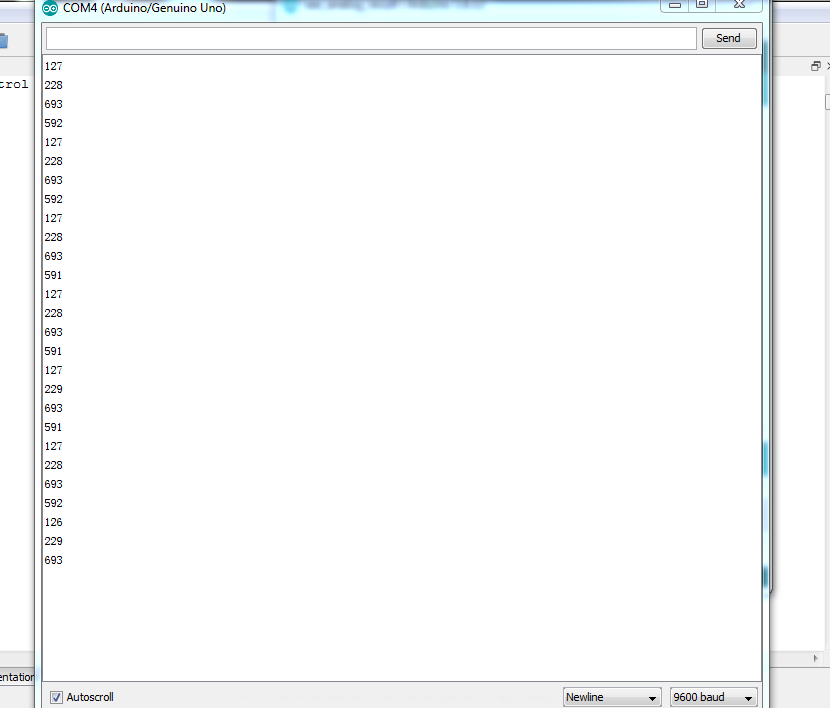
And how to plot a realtime graph? The signal i read from my arduino is :
1111.PNG
Then i use this coding in my octave to read and plot the graph:
srl_flush(s); %Flush the pending input/output.
y_temp = cell(10,1)
y = 0
while true
for i = 1:10
y_serial = str2num(char(srl_read(s,5))) %Convert the string (or character array) s to a number (or an array).
y_temp {i,1} = y_serial
endfor
y = cat(1, y, y_temp{1:10})
plot(y)
pause(1)
endwhile
srl_close(s)
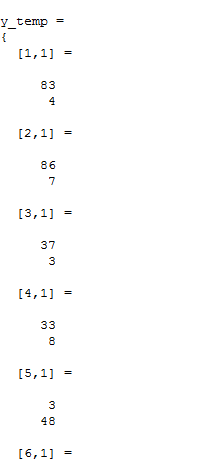
The result:
2222.PNG
Why there is a single digit data there????