[Date Prev][Date Next][Thread Prev][Thread Next][Date Index][Thread Index]
Re: problem with placing legend with GNUplot
|
From: |
Ben Abbott |
|
Subject: |
Re: problem with placing legend with GNUplot |
|
Date: |
Sun, 06 May 2012 15:44:30 -0400 |
On May 6, 2012, at 4:20 AM, Karel Karlovič wrote:
>
> 2012/5/6 Ben Abbott <address@hidden>
>
> On May 5, 2012, at 12:24 PM, Ben Abbott wrote:
>
> >
> > On May 5, 2012, at 12:12 PM, Karel Karlovič wrote:
> >
> >>
> >> 2012/5/5 Ben Abbott <address@hidden>
> >>> On May 5, 2012, at 7:50 AM, Karel Karlovič wrote:
> >>>
> >>>> 2012/5/4 Ben Abbott <address@hidden>
> >>>>
> >>>>> On May 4, 2012, at 12:38 AM, kovarka4 wrote:
> >>>>>
> >>>>>> Wonderful!
> >>>>>>
> >>>>>> I'm using fltk, but I want to use gnuplot.
> >>>>>>
> >>>>>> close all
> >>>>>> graphics_toolkit gnuplot work for one time. But when I close octave
> >>>>>> and
> >>>>>> open it again, there is again "fltk". Is there some possibility to
> >>>>>> change
> >>>>>> graphics_toolkit to gnuplot permanently?
> >>>>>>
> >>>>>> And I have some other problem. I'm using non-english symbols like á é
> >>>>>> í etc.
> >>>>>> Is there some possibility to use UTF-8?
> >>>>>>
> >>>>>> Thanks!
> >>>>>
> >>>>> To change the default, edit your ~/.octaverc file and change the line
> >>>>> ...
> >>>>>
> >>>>> graphics_toolkit fltk
> >>>>>
> >>>>> to
> >>>>>
> >>>>> graphics_toolkit gnuplot
> >>>>>
> >>>>> Regarding the non-english symbols, I tried ...
> >>>>>
> >>>>> text (0.5, 0.5, 'á é í')
> >>>>>
> >>>>> and the resulted rendered as desired. If it does not for you, the
> >>>>> problem is with gnuplot and its fonts.
> >>>>>
> >>>>> Ben
> >>>>
> >>>> Yes, it works with the legend!
> >>>> Problem with fonts is solved (maybe with using gnuplot?).
> >>>>
> >>>>
> >>>> But, when I make legend with
> >>>>
> >>>> legend(labels, "location", 'northeastoutside')
> >>>> legend("right")
> >>>> then color lines are still inside the box with graph. See pict1.png.
> >>>>
> >>>> When I make
> >>>>
> >>>> legend(labels, "location", 'northeastoutside') % not legend("right")
> >>>>
> >>>> color lines are outside, but text is on the border of graph. See
> >>>> pict2.png.
> >>>>
> >>>> Do you know how to get legend with lines alltogether outside of the box
> >>>> with graph?
> >>>>
> >>>> Thanks!
> >>>
> >>> If you can produce a simple example so that I (or someone else) can
> >>> duplicate what you're seeing, then we can file a bug report and provide a
> >>> work around for you.
> >>>
> >>> Running the developers sources for Octave 3.6.x, and with either the
> >>> gnuplot and fltk graphics toolkits, the following works for me (the
> >>> legend and plot box do not overlap)
> >>>
> >>> clf
> >>> plot(1:10, 1:10);
> >>> title("a very long label can sometimes cause problems");
> >>> legend({"hello world"}, "location", "northeastoutside");
> >>>
> >>> If I add ...
> >>>
> >>> legend right
> >>>
> >>> There is still no overlap between the legend and plot box.
> >>>
> >>> Ben
> >>
> >> OK, I made this also
> >>
> >> clf
> >> plot(1:10, 1:10);
> >> title("a very long label can sometimes cause problems");
> >> legend({"hello world"}, "location", "northeastoutside");
> >> legend("right");
> >> print('-dpng','example.png');
> >>
> >> and the result image stil has a line inside the graph box, part is over
> >> the box...see example.png
> >>
> >> And to my script...
> >>
> >> format long g
> >>
> >> vstup = [ 0.00500 0.02000 -0.02700 1.00000;
> >> -0.00100 0.01000 0.03000 2.00000;
> >> 0.00500 0.00100 -0.00200 3.00000;
> >> 0.00400 0.00100 0.00100 4.00000;
> >> 0.00400 0.00000 -0.00100 5.00000;
> >> 0.00500 0.00300 0.00200 6.00000;
> >> 0.00600 0.00000 0.00300 7.00000;
> >> 0.00400 -0.00100 0.00300 8.00000;
> >> 0.00500 -0.00100 0.00100 9.00000;
> >> 0.00700 -0.00100 0.00100 10.00000;
> >> 0.01200 0.00900 0.00800 11.00000;
> >> 0.00000 -0.00800 0.00100 12.00000;
> >> -0.00300 -0.01100 -0.00300 13.00000;
> >> -0.00400 -0.01800 -0.00900 14.00000;
> >> -0.00100 -0.00600 0.00000 15.00000;
> >> -0.00200 -0.01200 0.00200 16.00000;
> >> 0.00600 -0.00100 0.00700 17.00000;
> >> -0.00300 -0.00900 -0.00900 18.00000;
> >> 0.01200 0.01300 0.00800 19.00000;
> >> 0.00000 -0.00600 0.00000 20.00000;
> >> -0.00100 -0.01100 -0.00200 21.00000;
> >> 0.00600 -0.00100 0.00500 22.00000;
> >> 0.00100 -0.00600 0.00400 23.00000;
> >> -0.00300 -0.00800 0.00800 24.00000;
> >> 0.00400 0.00200 0.00800 25.00000];
> >>
> >> % globalni prumery
> >> plat = [744958.652 1040903.756 258.727]; % A
> >> %%%%%%%%%%%%%%%%%%%%%
> >> % C O M P U T I N G %
> >> %%%%%%%%%%%%%%%%%%%%%
> >> # aa = [0,interval(1,1),interval(2,1),ii]; % hodnota, kde ma byt umisten
> >> popisek
> >> # bb = [cas00;cas20;cas40;cas60]; % popisek na miste hodnoty aa
> >> ii=rows(vstup);
> >> interval = [ii/3,2*ii/3];
> >> figure(1)
> >> hold on
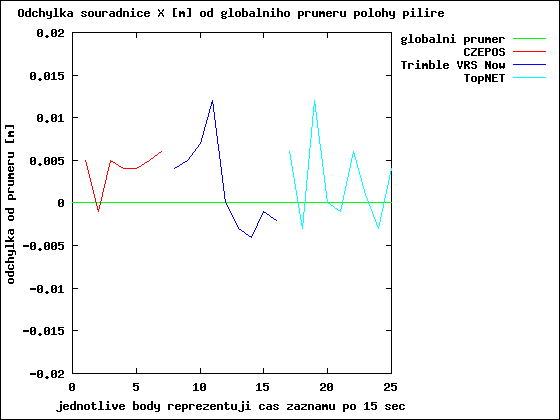
> >> title("Odchylka souřadnice X [m] od globálního průměru polohy pilíře")
> >> xlabel('jednotlivé body reprezentují čas záznamu po 15 sec')
> >> ylabel('odchylka od průměru [m]')
> >> plot([ii,0], [0,0],'-g')
> >> plot(vstup(1:7,4),vstup(1:7,1),'-r',vstup(8:16,4),vstup(8:16,1),'-b',vstup(17:end,4),vstup(17:end,1),'-c')
> >> axis([00,ii,-0.02,0.02])
> >> labels={'globální průměr','CZEPOS','Trimble VRS Now','TopNET'};
> >> legend(labels, "location", 'northeastoutside')
> >> print('example2.png','-dpng');
> >> hold off
> >> pause
> >>
> >>
> >> When I don't write
> >>
> >> legend("right");
> >>
> >> it is prety good. But the no-english symbols are bad (see in the script
> >> and on the image "example2.png").
> >>
> >> I'm so sorry, if everything is my stupid mistake.
> >>
> >> Karel
> >
> > Ok. Thanks.
> >
> > This definitely is not working correctly. I'll try to track down the
> > problem.
> >
> > Ben
>
> I did some experimenting, constructed a illustrative example, and entered a
> bug report.
>
> https://savannah.gnu.org/bugs/index.php?36408
>
> To work around this problem, you'll need to output the gnuplot stream, edit
> it, and then process it through gnuplot again.
>
> First, after producing the plot in Octave, type the following to save the
> gnuplot commands in "debug.gp"
>
> drawnow ("png", "example2.png", false, "debug.gp")
>
> Next edit "debug.gp" and modify the line begining with "set rmargin". The
> value may initially be negative, You'll need to experiment, but using 0.7
> should give a reasonable result.
>
> set rmargin screen 0.70;
>
> Save "debug.gp" and run gnuplot. From the gnuplot command prompt, type ....
>
> load "debug.gp"
>
> This will produce a new "example2.png"
>
> Ben
>
>
> <example2.png><debug.gp>
> Hi,
> the comand line was
>
> set rmargin screen 0.71750366116446;
>
> I tryed the value between 0.65 and 0.75. But it provide an empty image. Maybe
> I made something wrong...I don't know what to do.
>
> Images and debug.gp are in attachement.
>
> Karel
I edited your debug.gp and replaced the font specifications "{},10" with ",10".
The modifed debug2.gp and the example2.png it produced are attached.
Ben
 debug2.gp
Description: Binary data
- problem with placing legend with GNUplot, kovarka4, 2012/05/03
- Re: problem with placing legend with GNUplot, Ben Abbott, 2012/05/03
- Re: problem with placing legend with GNUplot, kovarka4, 2012/05/04
- Re: problem with placing legend with GNUplot, Ben Abbott, 2012/05/04
- Message not available
- Re: problem with placing legend with GNUplot, Ben Abbott, 2012/05/05
- Message not available
- Re: problem with placing legend with GNUplot, Ben Abbott, 2012/05/05
- Re: problem with placing legend with GNUplot, Ben Abbott, 2012/05/05
- Message not available
- Re: problem with placing legend with GNUplot,
Ben Abbott <=
- Message not available
- Re: problem with placing legend with GNUplot, Ben Abbott, 2012/05/06
- Message not available
- Re: problem with placing legend with GNUplot, Ben Abbott, 2012/05/06
- Message not available
- Re: problem with placing legend with GNUplot, Ben Abbott, 2012/05/06
- Message not available
- Re: problem with placing legend with GNUplot, Ben Abbott, 2012/05/06
- Message not available
- Re: problem with placing legend with GNUplot, Ben Abbott, 2012/05/06