[Date Prev][Date Next][Thread Prev][Thread Next][Date Index][Thread Index]
Re: Poor org-babel-tangle-file performance with more than 100 trivial no
|
From: |
Ihor Radchenko |
|
Subject: |
Re: Poor org-babel-tangle-file performance with more than 100 trivial noweb-references |
|
Date: |
Wed, 26 Jan 2022 19:43:15 +0800 |
Ihor Radchenko <yantar92@gmail.com> writes:

> Most of the CPU time is spent in org-babel-tangle-collect-blocks, which
> is basically another regexp search for all the source blocks in buffer.
> The scaling is still slightly non-linear - maybe your source block
> regexp is too complex:

After further investigation I found that it was not the problem with
source block regexp. The code was doing an extra backward regexp search
to find current headline. When there are no headlines in the Org file,
that search created quadratic scaling.

After caching the backwards search, the performance is further improved:
| N blocks | runtime | # of GCs |
|----------+---------+----------|
|       10 |   0.204 |        0 |
|       20 |   0.047 |        0 |
|       40 |   0.171 |        0 |
|       80 |   0.063 |        0 |
|      160 |   0.096 |        0 |
|      320 |   0.155 |        0 |
|      640 |   0.651 |        0 |
|     1280 |   0.419 |        0 |
|     2560 |   0.799 |        0 |
|     5120 |   1.628 |        0 |
|    10240 |   3.306 |        0 |
|    20480 |   5.633 |        0 |
|    40960 |  11.415 |        0 |

41k blocks in 12sec.

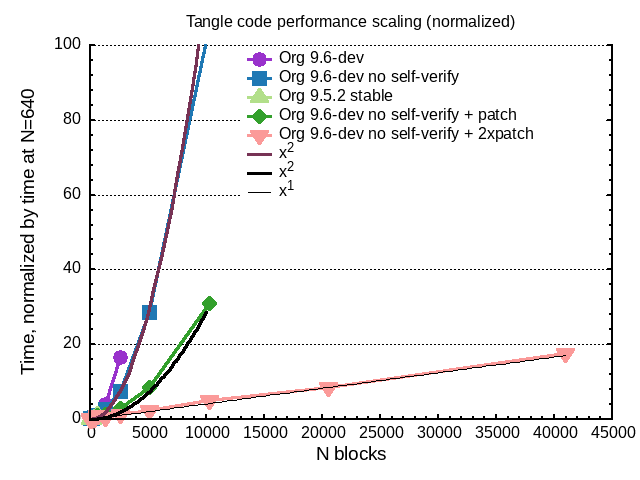
Graphical comparison:

The scaling becomes strictly linear after this fix:

Best,
Ihor

-----
Code used to generate the final set of the graphs:

#+name: nocache
| N blocks | runtime | # of GCs |
|----------+---------+----------|
|       10 |   0.027 |        0 |
|       20 |   0.049 |        0 |
|       40 |   0.121 |        0 |
|       80 |   0.391 |        0 |
|      160 |   1.426 |        0 |
|      320 |   6.765 |        0 |
|      640 |  23.972 |        0 |

#+name: cache
| N blocks | runtime | # of GCs |
|----------+---------+----------|
|       10 |   0.030 |        0 |
|       20 |   0.067 |        0 |
|       40 |   0.065 |        0 |
|       80 |   0.081 |        0 |
|      160 |   0.214 |        0 |
|      320 |   0.597 |        0 |
|      640 |   2.225 |        0 |
|     1280 |   9.221 |        0 |
|     2560 |  36.966 |        0 |

#+name: cache-no-self
| N blocks | runtime | # of GCs |
|----------+---------+----------|
|       10 |   0.078 |        0 |
|       20 |   0.075 |        0 |
|       40 |   0.063 |        0 |
|       80 |   0.085 |        0 |
|      160 |   0.095 |        0 |
|      320 |   0.178 |        0 |
|      640 |   0.311 |        0 |
|     1280 |   0.819 |        0 |
|     2560 |   2.302 |        0 |
|     5120 |   8.878 |        0 |
|    10240 |  32.706 |        0 |

#+name: cache-no-self+fix
| N blocks | runtime | # of GCs |
|----------+---------+----------|
|       10 |   0.118 |        0 |
|       20 |   0.106 |        0 |
|       40 |   0.136 |        0 |
|       80 |   0.157 |        0 |
|      160 |   0.139 |        0 |
|      320 |   0.212 |        0 |
|      640 |   0.542 |        0 |
|     1280 |   0.797 |        0 |
|     2560 |   1.533 |        0 |
|     5120 |   4.651 |        0 |
|    10240 |  16.745 |        0 |

#+name: cache-no-self+fix+fix2
| N blocks | runtime | # of GCs |
|----------+---------+----------|
|       10 |   0.204 |        0 |
|       20 |   0.047 |        0 |
|       40 |   0.171 |        0 |
|       80 |   0.063 |        0 |
|      160 |   0.096 |        0 |
|      320 |   0.155 |        0 |
|      640 |   0.651 |        0 |
|     1280 |   0.419 |        0 |
|     2560 |   0.799 |        0 |
|     5120 |   1.628 |        0 |
|    10240 |   3.306 |        0 |
|    20480 |   5.633 |        0 |
|    40960 |  11.415 |        0 |


#+begin_src gnuplot :var d1=nocache :var d2=cache :var d3=cache-no-self :var
d4=cache-no-self+fix :var d5=cache-no-self+fix+fix2 :file benchmark1.png
set title 'Tangle code performance timing'
US='u 1:2 w lp ps 2'
set xlabel "N blocks"
set ylabel "Time, sec"
set key top right
plot d1 @US t'Org 9.5.2 stable', d2 @US t'Org 9.6-dev', d3 @US t'Org 9.6-dev no
self-verify', d4 @US t'Org 9.6-dev no self-verify + patch', d5 @US t'Org
9.6-dev no self-verify + 2xpatch'
#+end_src

#+RESULTS[e95dafc7253d218d2a9ed19caa75911660e72f77]:
[[file:/home/yantar92/.data/52/0930af-75ae-4d88-ae6a-d8dde39ecc72/benchmark1.png]]

#+begin_src gnuplot :var d1=nocache :var d2=cache :var d3=cache-no-self :var
d4=cache-no-self+fix :var d5=cache-no-self+fix+fix2 :file benchmark2.png
set title 'Tangle code performance scaling (normalized)'
US='w lp ps 2'
set xlabel "N blocks"
set ylabel "Time, normalized by time at N=640"
set key top right
set yrange [0:100]
plot d2 u 1:($2/2.225) @US t'Org 9.6-dev', d3 u 1:($2/0.311) @US t'Org 9.6-dev
no self-verify', d1 u 1:($2/23.972) @US t'Org 9.5.2 stable', d4 u 1:($2/0.542)
@US t'Org 9.6-dev no self-verify + patch', d5 u 1:($2/0.651) @US t'Org 9.6-dev
no self-verify + 2xpatch', x*x/870000 t'x^2', [0:10000] x*x/3500000 t'x^{2}',
x/2400 t'x^{1}'
#+end_src

#+RESULTS[c69cdd0dfb08f37c73c6a202f415336155a390ab]:
[[file:/home/yantar92/.data/52/0930af-75ae-4d88-ae6a-d8dde39ecc72/benchmark2.png]]
