bug-apl
[Top][All Lists]
Advanced

[Date Prev][Date Next][Thread Prev][Thread Next][Date Index][Thread Index]

Re: [Bug-apl] Performance optimisations: Results


From: Juergen Sauermann
Subject: Re: [Bug-apl] Performance optimisations: Results
Date: Sun, 06 Apr 2014 16:32:10 +0200
User-agent: Mozilla/5.0 (X11; Linux i686; rv:17.0) Gecko/20130330 Thunderbird/17.0.5

Hi,

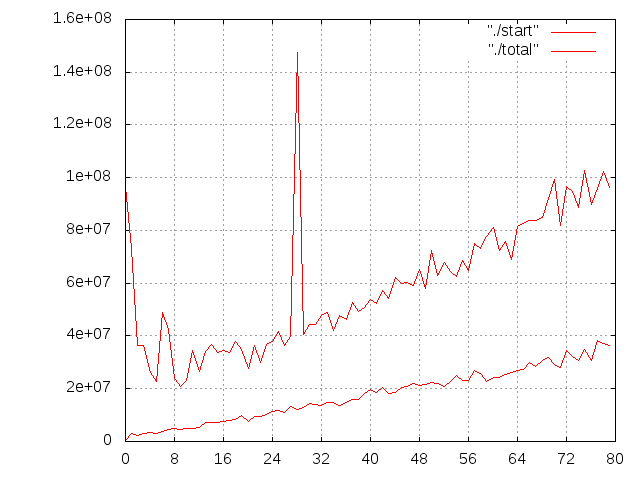
one more plot that might explain a lot. I have plotted the startup times and the total times
vs. the number of cores (1024÷1024 array).

For small core counts (i.e. < 6...10), the startup time is moderate and the total time decreases rapidly.

For more cores, the total time increases again. This is most likely because the timer per core becomes negligible
and the join time begins to dominate the total time.

Both start and join times seem to be more-or-less linear with the number of cores which is probably because
the master thread is doing all that. It would have been smarter to do the start and join in parallel which
would then cost O(log P) instead of O(P) for P cores.

/// Jürgen


On 04/04/2014 04:52 PM, Elias Mårtenson wrote:
Thanks. I'll look into that a bit later.

I wouldn't expect must strangeness in terms of the environment. The machine more or less idle at the time (as far as I remember). Hyperthreading is also turned off on the machine in order to provide reliable multicore behaviour (if enabled, the operating system will report 160 CPU's).

Also, Solaris tends to be very reliable when it comes to multithreaded behaviour.

I believe you are on to something when you are talking about overhead to dispatch and join the threads. It's likely that with 80 threads the job itself is just too short for it be any significant portion of all the time taken. This, of course, brings us back to whether coalescing is something that should be done.

Regards,
Elias


On 4 April 2014 22:47, Juergen Sauermann <address@hidden> wrote:
Hi Elias,

thanks, very interesting figures. Looking at the 1024×1024 numbers the behavior of
your machine is rather non-linear. Not in the "scales badly" sense but completely irregular.

For example, 6 threads have finished after about 23 Mio cycles while 70 threads after about 91 Mio cycles.
At the time the 6 threads are finished, none of the 70 threads has even started.

Often the startup and more often the join time is longer than the active execution time.
On my 1-CPU 2-core box this is completely different.

There could be several reasons:

Inter-CPU sync is much longer than inter-core sync (on a 10×8 core machine) ?
Does the cycle counter work reliably on a multiple-CPU ?
Wrong core affinities ?
CPUs busy with other things ?

If you want to visualize that, try gnuplot in the same directory as the txt files
and then give the following commands:

set xtics 32
set grid
plot   "./results_6.txt" with lines 1
replot "./results_70.txt" with lines 2
pause -1

/// Jürgen


On 04/04/2014 05:49 AM, Elias Mårtenson wrote:
Here are the results. I modified main.cc so that it accepts the thread count as an argument, and ran the test 80 times. I then increased the array size from 1024x1024 to 6000x1024 and re-ran the test again. The results are attached.

If I extend the array larger than that, the interpreter crashes.

Regards,
Elias


Attachment: start-total.png
Description: PNG image


reply via email to

[Prev in Thread] Current Thread [Next in Thread]