Description: JPEG image
|
| From: | Saeed Nozhati |
| Subject: | [igraph] Question |
| Date: | Mon, 19 Jun 2017 13:42:26 -0600 |
Hi
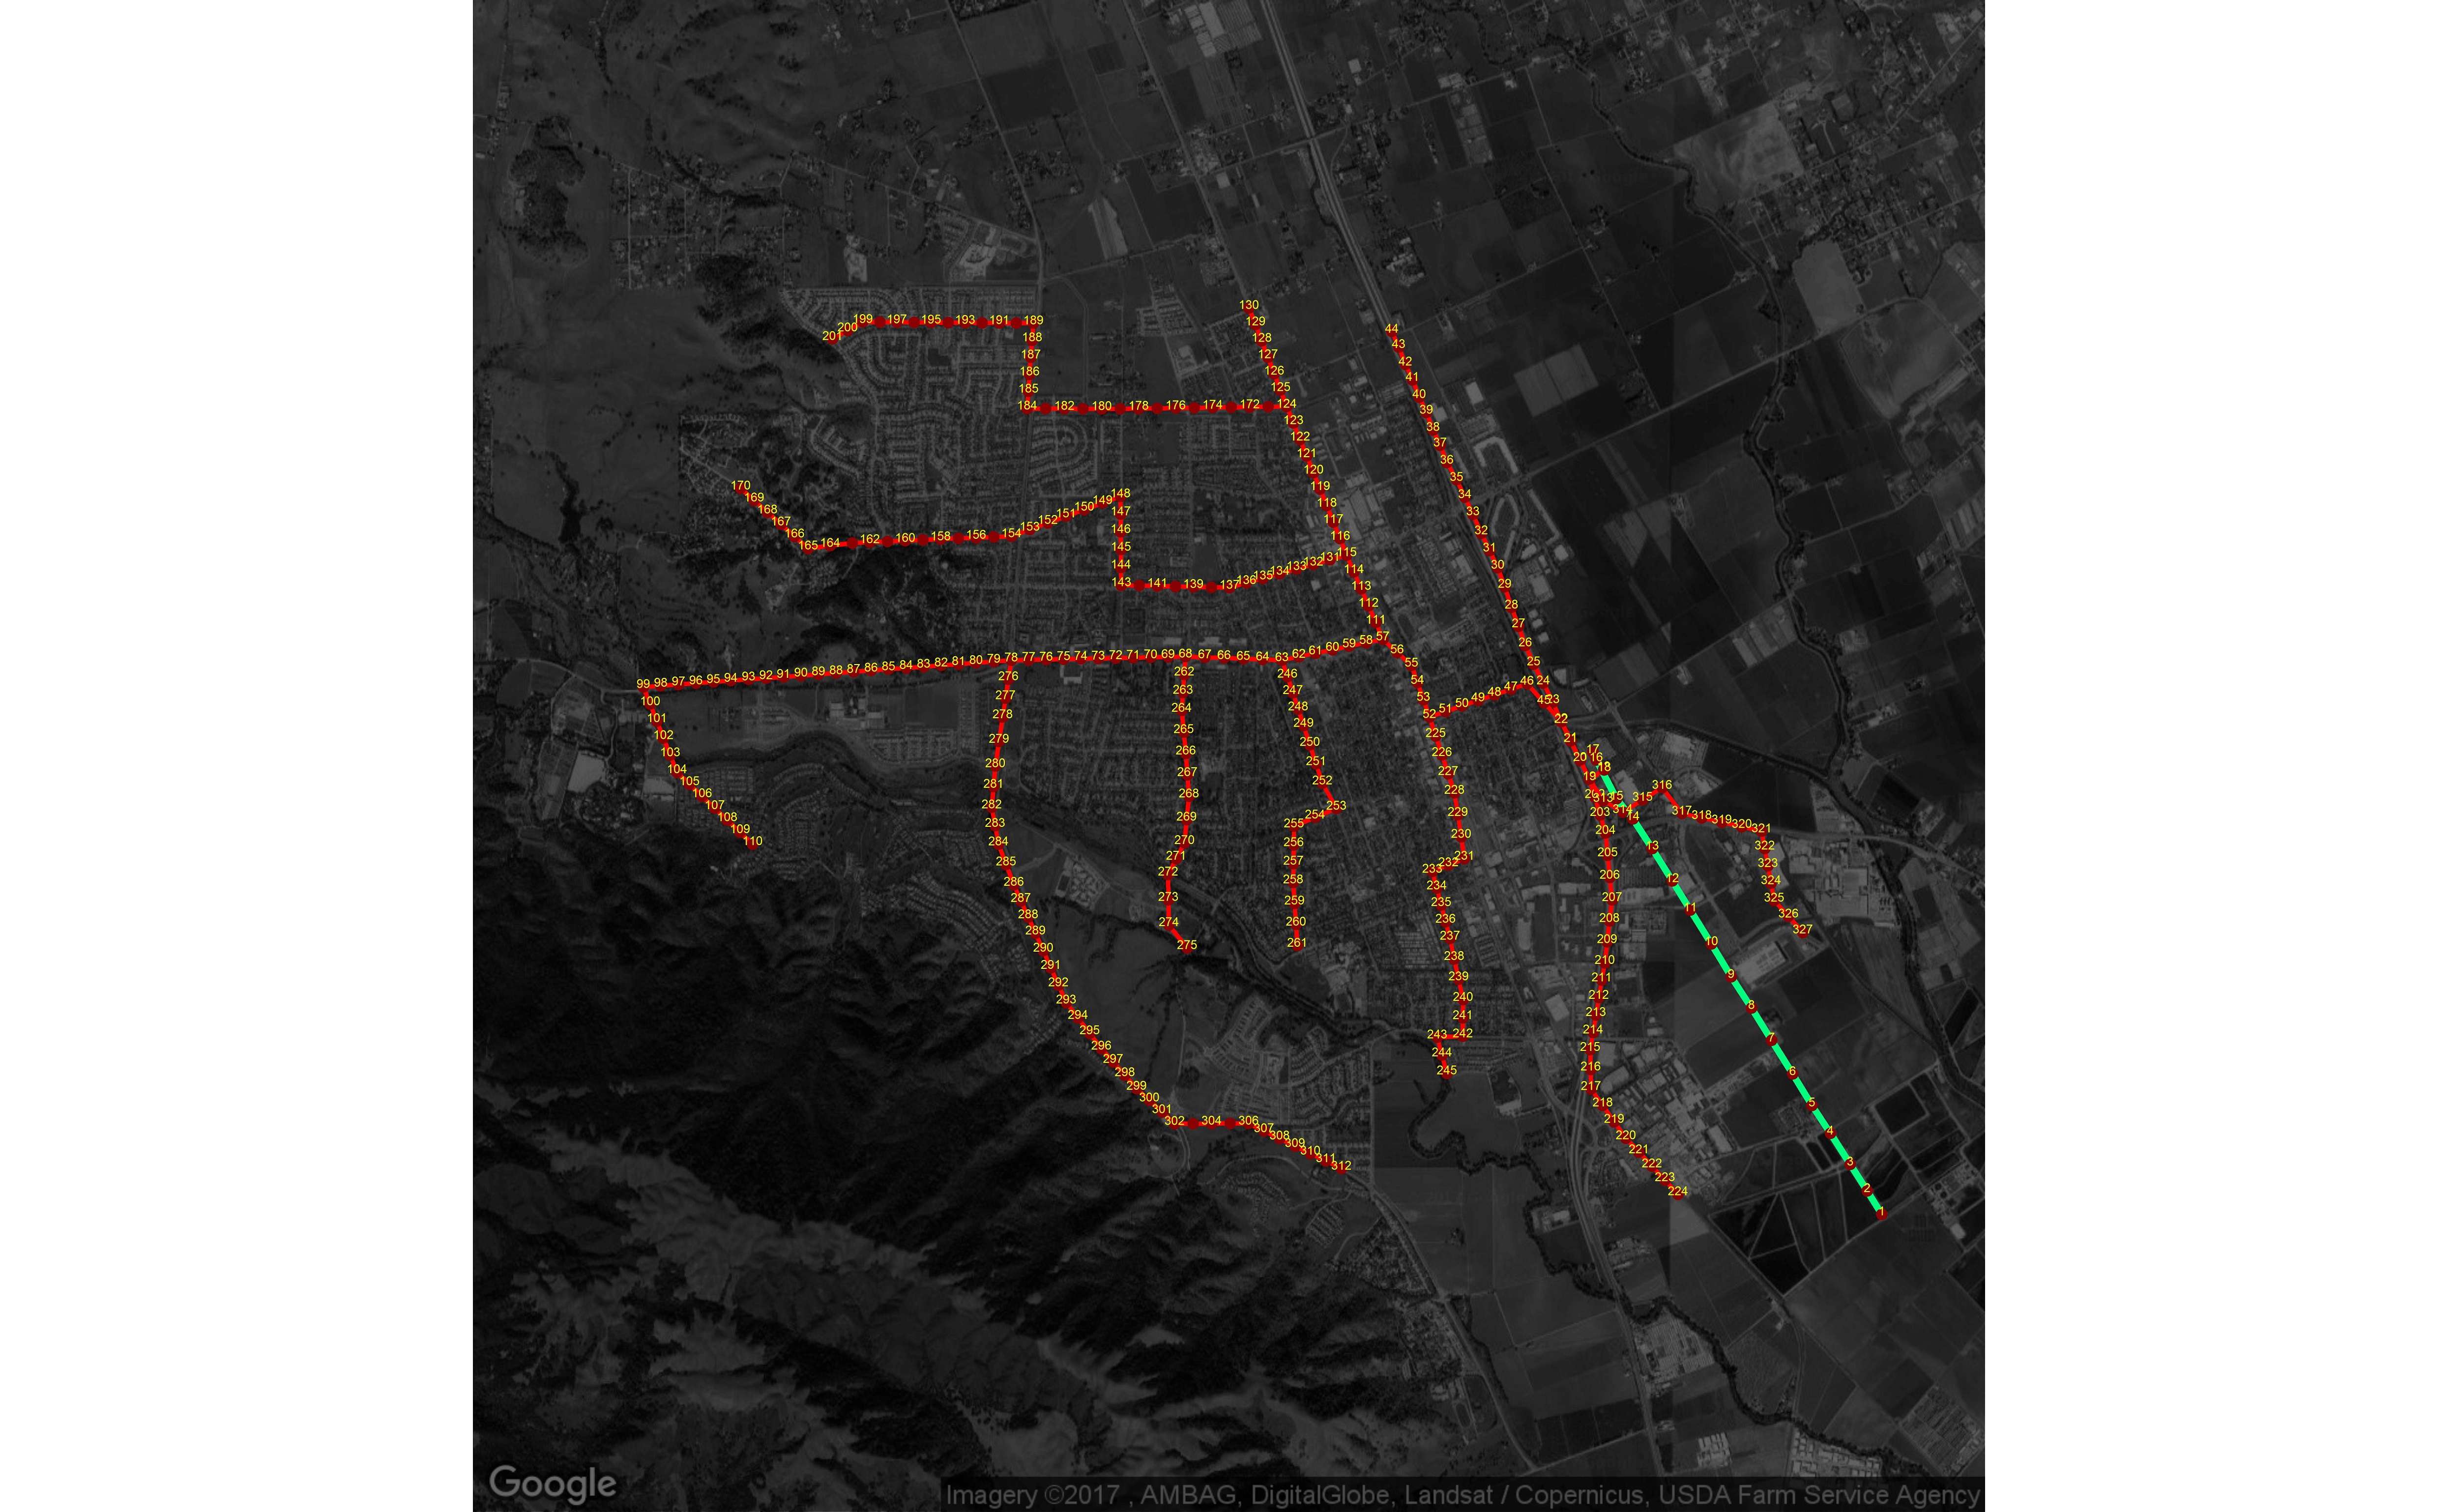
I am Saeed Nozhati, PhD candidate at Colorado State University. I would like to plot the electric power network of a city with igraph and then take advantage the power of igraph package. I have plotted by ggplot2 and ggmap, shown here. The correct location and dependency of components are shown in the picture.
I have the adjacency matrix all 327 components and their geocodes as attached The following is my code:
adj= read_excel("Adj.xlsx",sheet="
C= read_excel("Adj.xlsx",sheet="
adj=adj[,-1]; C=as.matrix(C); adj=as.matrix(adj)
net <-graph_from_adjacency_matrix(
plot.igraph(net, edge.curved=.1, layout=C)
However, igraph shows a very messy and wrong graph. I really appreciate if you would help me.
Thanks in advance for helping me out.
Saeed Nozhati
![]() 8.jpeg
8.jpeg
Description: JPEG image
![]() Adj.xlsx
Adj.xlsx
Description: application/vnd.openxmlformats-officedocument.spreadsheetml.sheet
| [Prev in Thread] | Current Thread | [Next in Thread] |