Dear igraph developers,
I’m relatively new user of R and igraph, so please excuse me if my question is naive. I found igraph very useful in my work however I experienced a problem with plotting the graph, which I cannot overcome easily.
I worked on following vertex vector:
g1 <- graph ( edges=c(
1, 12,
1, 10,
1, 9,
9, 2,
9, 2,
1, 3,
1, 4,
9, 8,
1, 6,
9, 5,
1, 6,
1, 7,
1, 7,
1, 9,
9, 11,
9, 11,
1, 5,
1, 13,
1, 13), n=13, directed=T)
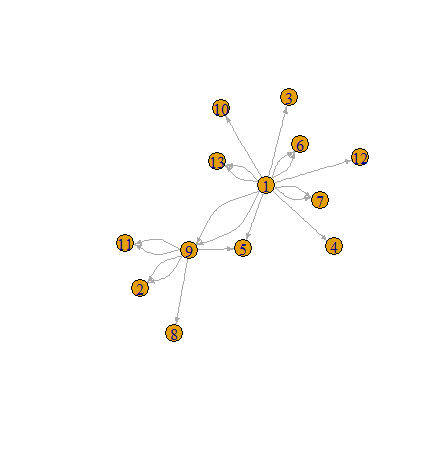
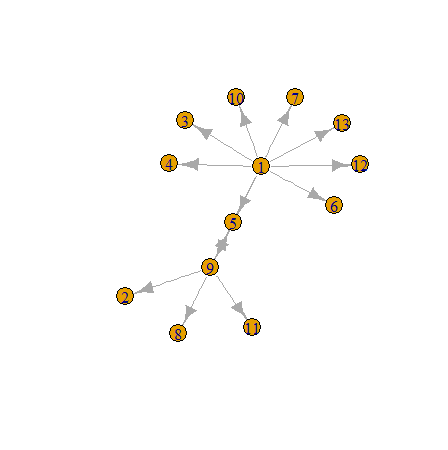
Then Iafter simplification I received following graph (see below). The problem is that on this graph I cannot distinguish 9->5 and 1->5 from 1->9, since they are overlapping each other (see below). From the graphical point of view problem solves when I reverse one of two 1->9 nodes to 9->1, however in my case directions are crucial. Is there a simple method to improve this graph without manipulation in the data vector?
g2 <-simplify (g1)plot
Thank you in advance,
Piotr Wojciechowski
_______________________________________________
igraph-help mailing list
address@hidden
https://lists.nongnu.org/mailman/listinfo/igraph-help