Description: PNG image
|
| From: | Dmitri A. Sergatskov |
| Subject: | Re: Trying to make a respectable looking Hist3 plot and having big difficulty |
| Date: | Wed, 2 Aug 2017 07:49:44 -0500 |
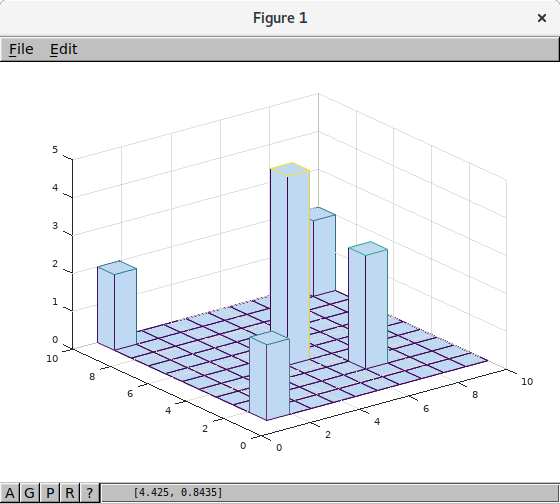
On Wed, Aug 2, 2017 at 2:46 AM, Tim Pierce <address@hidden> wrote:_Trying to understand why the Octave-Forge Hist3 Example looks like this: (see picture at bottom of online help)
https://octave.sourceforge.io/statistics/function/hist3.html
But when I run that exact code mine looks like this
http://imgur.com/gallery/GBoq6
When I run it on my data it looks just as bad. I would love to showcase these 3D bars showing that Octave rivals some of our overpriced BI software but right now I'm struggling with getting things to look passable
Would LOVE any help to get this looking okayI tried all 3 graphic_toolkits qt fltk gnuplot and they all showed the same poor quality plot. :-(
![]() hist3.png
hist3.png
Description: PNG image
| [Prev in Thread] | Current Thread | [Next in Thread] |