Description: PNG image
|
| From: | Kavya Manohar |
| Subject: | Re: Mismatch between plotted graph and its saved file. |
| Date: | Thu, 27 Feb 2014 20:23:14 +0530 |
I tried your code on my comp. and it works !On Thu, Feb 27, 2014 at 6:37 AM, Kavya Manohar <address@hidden> wrote:
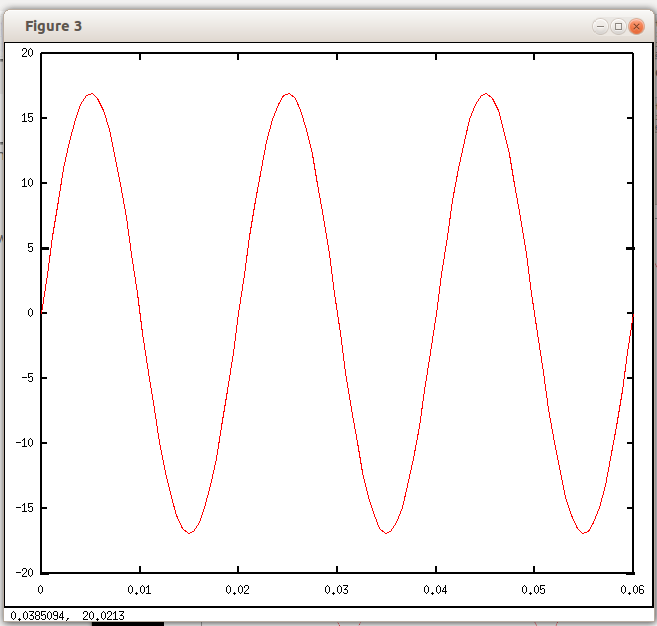
Hi,I plotted a sinusoid and a straight horizontal line on same graph. But when it was saved in '.png' format using print function the straight line did not appear in the figure.The following is the code.f=50;t=[0:1/(35*f):3/f];Vm=12*sqrt(2);A=Vm*sin(2*pi*f*t);plot(t,A,"1",t,Vm,"1");print("test.png")Why could it be so? What is the way out?ThanksKavya ManoharWhat version of octave?which OS are you using?
Doug
![]() testfig.png
testfig.png
Description: PNG image
![]() testfig2.png
testfig2.png
Description: PNG image
![]() test.png
test.png
Description: PNG image
| [Prev in Thread] | Current Thread | [Next in Thread] |