I am trying to estimate the transfer function of a system (SISO) based on time-domain data. I have tried by directly taking the FFT of the time-domain data and also by using tfestimate. The results (magnitude) are somewhat different. The red line is done by taking the FFT of the data, and the blue line is by using tfestimate (ignore the green line):
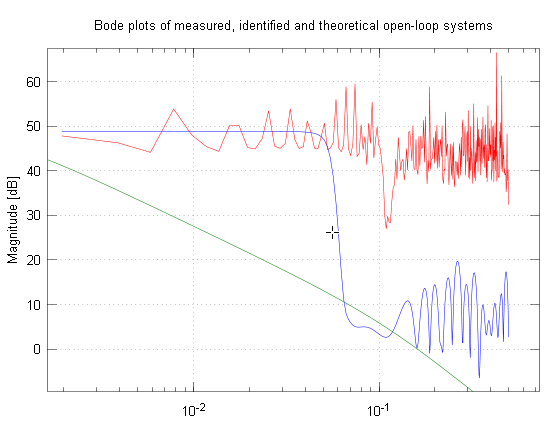
I am not sure which one to trust! I would like to use this to compare to a model generated by system identification (e.g. arx). The phase plot looks good.
The relevant lines of code (sorry I can't share the actual data) are:
%% FFT of time-domain data
% Use next highest power of 2 greater than or equal to length(temp) to calculate FFT.
nfft = pow2(nextpow2(length(temp)));
% Take fft
fft_temp = fft(temp,nfft);
fft_heater = fft(heater_ip,nfft);
% This is an evenly spaced frequency vector
f = (Fs/2)*linspace(0,1,nfft/2+1);
tf_meas = fft_heater .* fft_temp ./ fft_heater.^2;
% Compute the phase
phase = unwrap(angle(tf_meas));
phase = phase*180/pi;
%% Using tfestimate
[mag_meas,freq_meas]=tfestimate(heater_ip,temp,[],[],nfft,Fs);
I am using Octave 3.6.4 on Windows XP if that makes a difference.
Thanks in advance,
Arnaud