[Date Prev][Date Next][Thread Prev][Thread Next][Date Index][Thread Index]
Re: Plotting a function of 3 variables ?
|
From: |
Martin Helm |
|
Subject: |
Re: Plotting a function of 3 variables ? |
|
Date: |
Wed, 25 Apr 2012 19:00:39 +0200 |
|
User-agent: |
Mozilla/5.0 (X11; Linux x86_64; rv:12.0) Gecko/20120421 Thunderbird/12.0 |
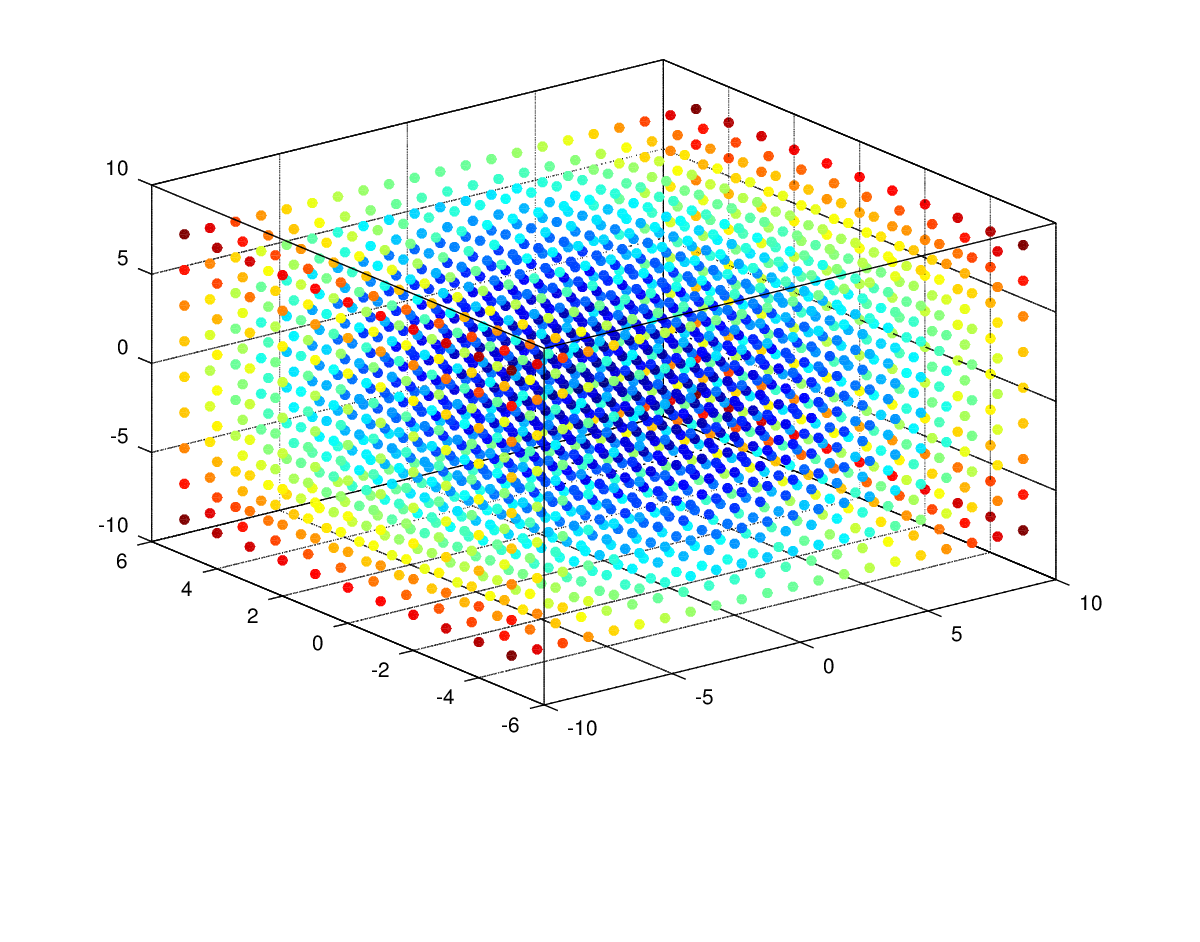
Oisin found meanwhile that scatter3 does what he want

[x,y,z] = meshgrid(-10:1:10,-5:1:5,-8:2:8);
% this creates x,y and z 3-D arrays, x contains -10:1:10 replicated
length(-5:1:5)xlength(-8:2:8) times, y contains -5:1;5 replicated .....
c = x.^2+y.^2+z.^2;
% c is now our function of 3 variables
figure
scatter3(x(:),y(:),z(:),5,c(:),'filled')

which gives the attached result with fltk but does not work with gnuplot.

Anyone has an idea if that can somehow work with gnuplot as well?

Otherwise I file a bug.
 scatter3.png
Description: PNG image
Re: Plotting a function of 3 variables ?, Martin Helm, 2012/04/25