[Date Prev][Date Next][Thread Prev][Thread Next][Date Index][Thread Index]
imagesc problem
|
From: |
febty febriani |
|
Subject: |
imagesc problem |
|
Date: |
Sat, 15 May 2010 22:05:08 +0900 |
Hi, everyone.
I have a problem with imagesc command.
following is my script:
fh=fopen("fft.dat","r");
y=fscanf(fh,"%lf");
Fs=1;
step=1800;
window=4096;
[S, f, t] = specgram(y, 2*nextpow2(window), Fs, window, window-step);
S=S/max(max(S));
fclose(fh);
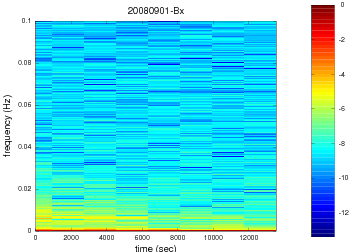
disp(size(S));imagesc(t,f,log((S)));set(gca,"ydir","normal");colorbar;axis([0 13530 0 0.1]);
the result of the first script is graph (attached).
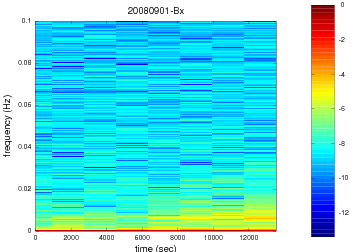
I changed my script like below (please pay attention the red line (I added fliplr)). the result is graph1 (attached).
fh=fopen("fft.dat","r");
y=fscanf(fh,"%lf");
Fs=1;
step=1800;
window=4096;
[S, f, t] = specgram(y, 2*nextpow2(window), Fs, window, window-step);
S=abs(S);
S=S/max(max(S));
fclose(fh);
disp(size(S));imagesc(t,f,log(fliplr(S)));set(gca,"ydir","normal");colorbar;axis([0 13530 0 0.1]);
I am just wondering why the dimension or segment (I have 8 segment on
my both result) on both result didn't change.
Logically, because my
input data for spectrogram are not complete, the first segment in
graph (the result of the first script) should be the last segment. Based on this assumption, I added fliplr to produce the second result (graph1), but dimension of the segments are still same.
Maybe, there are some mistakes with my script, any kind help is appreciated.
Thanks very much.
--
******
febty febriani
Indonesian Institute of Sciences
Research Center for Physics
Kompleks PUSPIPTEK
Serpong, Indonesia, 15314
 graph.png
Description: PNG image
graph1.png
Description: PNG image
| [Prev in Thread] |
Current Thread |
[Next in Thread] |
- imagesc problem,
febty febriani <=