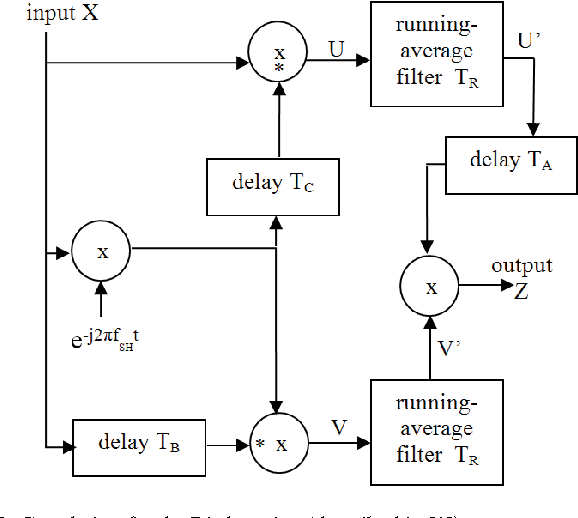
It may be helpful to note that that diagram is from this document, section 10.2.2.5.3.
http://www.etsi.org/deliver/etsi_ts/102800_102899/102831/01.02.01_60/ts_102831v010201p.pdf
Ron
On 03/15/2018 09:59 AM, Anshul Thakur
wrote:
Hi Marcus,
Thank you for your inputs.
On 13 March 2018 at 22:22, Müller, Marcus (CEL) <address@hidden> wrote:
Hi Anshul,
do you normalize your correlation by the received signal power in that
same window?
No. I wasn't normalizing the correlations. I'm using the image attached as reference design.I guess I got a little excited to see the peaks in Matlab that I did not even consider the energy of the signal as a possible normalization denominator. :D
How's your frequency correction doing? If you don't have frequency
detection at that point, your signal might get decorrelated.
The preamble detection step itself is supposed to find a coarse frequency-offset which must befurther refined by correlation with the Carrier-Distribution-Sequence(cds) in the next step. So, no, currently, there is no frequency correction as per se.
You can solve both by employing a fixed delay correlation of your
receive signal; IIRC, P1 is roughly split into three parts: A middle
part that repeats in the front and at the end of the symbol. Let's say
that repeated part in the front is N samples long. Take these N,
correlate with the N that follow, divide by the power of these samples.
Correct. I was not dividing by the power. I did that and the slopes have become more smooth except occasional blips over a single sample.I am correcting for these occasional blips by comparing my current value with the running average a small previous window (5 samples currently), the reasoning being -If the signal is rising fairly consistently, the current value will be greater than the average of what came in the short term past.By doing so, I am able to get a coarse window of prospective sample ranges where the signal might be starting.
I will now try to filter them further by correlating with the CDS and revert back if I run into more trouble. Many thanks!
You'll not only get a value that should be independent from absolute
receive signal strength (as long as fading is not faster than ¼ of the
P1 length), and as a bonus, the correlation coefficient's phase allows
for a relatively robust frequency offset estimate. You can use that
estimate to correct your receive signal and get a better detection
result :)Best regards,
Marcus
>
On Tue, 2018-03-13 at 20:38 +0530, Anshul Thakur wrote:
> Hello all,
>
> I am trying to implement a DVB-T2 receiver's P1 symbol detection block using C++ in GNURadio. From a non-real time code in MATLAB, I can see that the correlation peaks during the P1 symbols are almost 50 to 100 times larger than the rest of the time. This rise is not steep in consecutive samples.
>
> However, I am having trouble in implementing this as a kind of stream-algorithm that operates on blocks of data (like a real receiver would) rather than the entire thing (in GNU Radio, that is). The problem is thus:
>
> I want to detect when the signal correlation reaches its peak-plateau region. While the overall trend in correlations does rise, the consecutive values may fluctuate in both positive and negative directions due to noise/fading effects. I've tried a few rudimentary approaches:
>
> 1. Average the correlations over some period and see if the current average is greater than some sample at an offset in the history by a threshold value to term it as rising. While it can give some degree of rise, it is not very good at peak detection.
>
> 2. Keep a history of consecutive slopes in my block and use a small average. The fluctuations should die down and give some value near to 0. This doesn't seem to happen. The results are not satisfactory. Also, the consecutive slopes are also not that spectacular to contrast with the average case.
>
> Possibly, I need to use some smoothening and differentiator filter. Can you point to a sample implementation of a similar kind? Or give some more ideas I could experiment with?
>
>
> Warm regards,
> Anshul