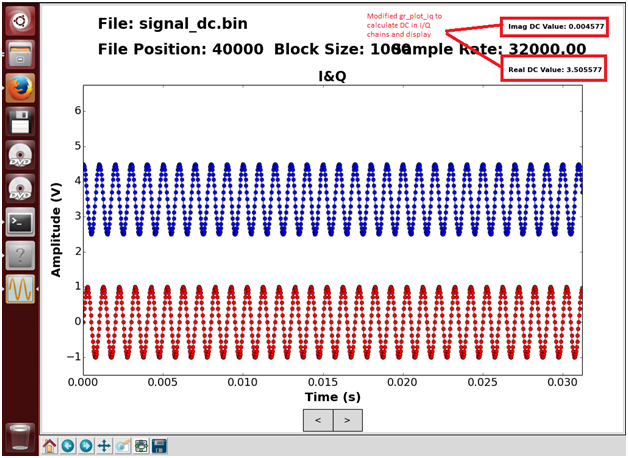
Thanks for your comments. Yes, I have used offline plotting utilities frequently. I think a few interesting and useful things are missing in these utilities that can be added. For example, in one application I wanted to know the DC offset or simply DC value present in a burst. I couldn't do that with original gr_plot_iq so I modified it to get something like this
Another on imgur
Things in my mind are
1. DC calculation and removal from the signal display
2. Signal power calculation and display
3. Filtering of signal (Highpass, lowpass, etc)
4. Mathematical operation (scale/Normalize, raising to power, anyother)
5. Saving portion of interest to another file. Often when doing analysis of test data, I came across a portion of data that is interesting (e.g unusual behavior) and I want to save/extract it from file. Currently, not possible.
6. Tabbed Display of the signal in various domain unprocessed (time, constellation, spectrum,) processed (mathematical operation, scale/normalize, filtered), I miss this feature because often I want to see spectrum, constellation and I/Q of a burst to see what is going on.
7. Also, I am currently thinking of adding an animate/play feature that can play the file slowly i.e user specified rate.
These things are often used in offline analysis I think.I will be happy to have feedback and comments on these from the community and things people want to have.
Further to discuss the about applying the filter during the offline analysis. To do this following needs to be done behind-the-scene
a. Get data from the file file (open file using "open", read desired data using scipy.fromfile()), at start of application.
b. Get filter specification from the user using GUI (gain, sample_rate, cutoff_freq, attenuation,window,transition_bw)
c. Get filter coefficients using filter specification (filter.firdes.*)
d. When user clicks submit/apply button, call a method/function that does the convolution of data with filter coefficients. Also apply group delays adjustment to convolution output.
e. Update the filtered data plot and show it to user when user clicks on that tab.
f. Give feedback to the user about the e.g order of the filter.
From a user perspective, he would have some GUI interface as below, I also marked the QT components that can be used to provide this GUI
Input file has to be provided by the user. He can select filter type, input filter parameters to design a filter of interest, and can click on the tabs for view data in the any domain he wants e.g filtered data or original data.
That is what currently on my mind. Waiting for feedback.
Regards,
Usman
On Tue, Mar 8, 2016 at 3:38 AM, West, Nathan <address@hidden> wrote:
Hi Usman,Since you've been using GNU Radio for 3 years now and you have an interest in this project hopefully you have some offline tools that you personally want to see or personal issues with the current offline tools. Perhaps you can explain those a little bit along with some general approaches to how you would do it. This might spark an interesting conversation here that would refine your application. As an example, say you're looking at some signal in this offline tool and you want to apply a filter to it and see what happens. What do you imagine is required to do this both from a behind-the-scenes perspective and from a user perspective?Don't feel restricted to answering my specific question. Pick whatever visualization/analysis is most interesting to you and publicly brainstorm. Someone will probably have commentary or feedback on it.Cheers,NathanOn Sat, Mar 5, 2016 at 1:13 AM, Usman Haider <address@hidden> wrote:_______________________________________________Hi,After going through all the GSoC project ideas and relevant GSoC pages. I concluded that I should apply for the following project because it matches my skills most. In this way, I can make my contribution to GnuRadio maximum.Offline Analysis and Visualization Tools ( Mentor Tim O'Shea)I know C++, Python, and QT, so I fulfill the prerequisite criteria. I am using Gnuradio for more than 3 years now. I am on mailing list (Bob) since quite some time. As a first step I made my account on github.Next, I am going to work on my application/proposal. I'll keep visiting mailing list and GSoC pages so that I do not miss anything.Regards,Usman
Discuss-gnuradio mailing list
address@hidden
https://lists.gnu.org/mailman/listinfo/discuss-gnuradio