> What I meant was that you plot the result of your timing + phase recovery
> into an XY plot, that would take care of those additional points you're seeing.
I have to confess that I don't even know what that means or how to go about accomplishing it. I have to take baby steps because I'm a baby. ;-) If you could point me to an example or some other things to try, that would be helpful.
I looked through the examples that ship with GNURadio and didn't see anything obvious. Also, I looked through the GRC block tree to see if I could try something. There's a Synchronizers section. Something from there?
You thought maybe it was oversampled. It occurred to me that maybe the X-Y chart rate should be samp_rate/8, but I tried that and the chart still look largely the same.
-----Original Message-----
From: address@hidden [mailto:address@hidden On Behalf Of Martin Braun
Sent: Friday, July 17, 2015 1:20 PM
To: address@hidden
Subject: Re: [Discuss-gnuradio] trouble with QAM mod/ WX GUI Constellation Sink
On 17.07.2015 12:43, Bill Eaton wrote:
> From Martin Braun:
>
>>My preference is to build the demod/sync chain with it's own blocks,
>>and then just output the complex symbols
>
>> into either an X/Y plot (WX) or the QT Constellation Sink
>
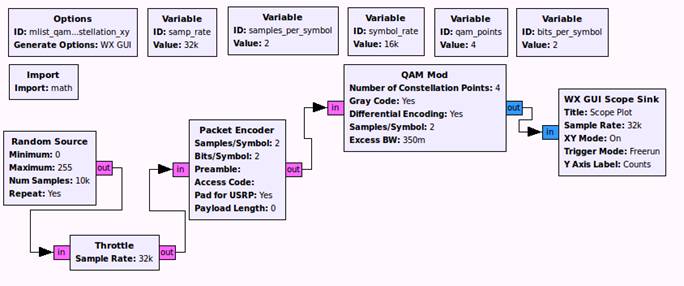
> Even an X/Y plot ends up looking funny. I’ve attached a GRC file for
> X-Y, and when you turn on persistence, it looks better. But it’s very
> strange. Maybe my bits_per_symbol is wrong. Or maybe the sample rate
> for the X-Y chart should be different than the random sample rate?
> Here’s the 4 QAM X-Y.
Your plot looks fine, it's just oversampled (but perfectly time-synchronized, I'm guessing this is post-pulse shaping + noise?).
What I meant was that you plot the result of your timing + phase recovery into an XY plot, that would take care of those additional points you're seeing.
M
_______________________________________________
Discuss-gnuradio mailing list
https://lists.gnu.org/mailman/listinfo/discuss-gnuradio